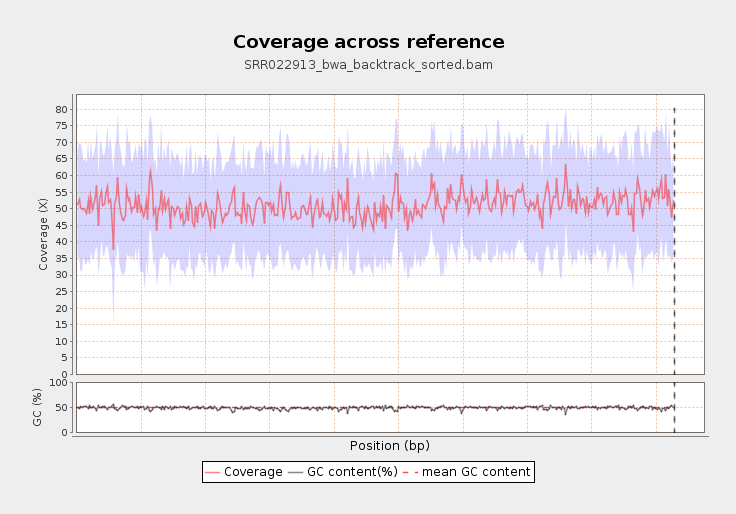
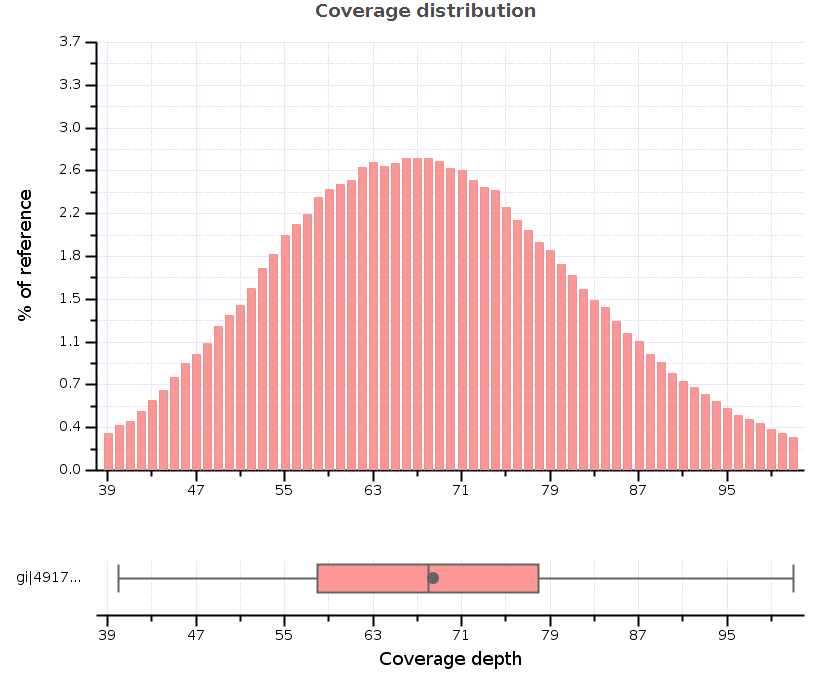
Nowadays, when whole exome and whole genome alignments are becoming fairly routine and even gene panels often target hundreds of genes, it’s no longer a valid option for researchers to visually check the quality of alignments. Generating coverage measures and statistics is a good tool for identifying sequencing or alignment problems and therefore offers a great alternative for browsing through alignments.
There are two frequently used coverage measures: coverage depth is the number of reads covering a specific base position and “coverage %” is the proportion of a targeted region covered by reads (i.e. basically the proportion of a region with non-zero coverage depth). Of course, there are countless other possibilities for “measuring” coverage: you can count the reads aligned to a specific region, you can calculate mean or median coverage depth, you can calculate coverage in sliding windows throughout the whole genome. It all depends on what you’re interested in.
Let’s take a look around available tools for generating coverage statistics! First, for the GUI lovers, two toolsets with graphical interfaces:
QualiMap
- Written in Java/R.
- Can be used for RNA-Seq experiments as well.
- Can generate coverage and quality statistics (e.g. coverage across reference, genome fraction by coverage, mapped reads clipping profile).
BAMStats
- Written in Java, using the Picard Java API.
- Provides statistics on: coverage, start positions, MAPQ values, mapped read lengths and edit distances for each reference contig.
- Has command line and GUI versions.
Although both of these GUI based tools are quite nice and can be used to take a quick look at the general coverage and quality of the alignments, command line methods (including some previously used tools and “home made” scripts) provide much more flexibility. I’ll write about these command line options (or at least some of them) next week.


