Meet Fred.
This story starts with a hypothetical PhD student. Let’s call him Fred. Fred is doing a PhD in food science and has a vegetarian flat-mate (let’s call her Karen).
After living with Karen for a few months, Fred noticed that Karen and her vegetarian friends eat a lot of beans. Being the curious person he is (meaning, his advisor was bugging him for months about not publishing enough), Fred decided to look into this phenomenon and came up with an experiment. Following his usual workflow (see Figure 1), he first came up with a hypothesis, based on his observations. The hypothesis was: vegetarians eat more beans than meat-eaters.
Then he started to plan his experiment: First, he figured out a way for measuring bean consumption:
What to measure?
- amount of beans eaten per month
- vegetarian or not?
- other stuff (cheap shots in the dark)
How to measure it?
- questionnaire
Considering the fact, that he had no actual resources for this study, Fred decided to work with what he has access to. What he and most university researchers have an unlimited access to is… university students.
So at the end of one of his classes, Fred gave his carefully created questionnaire to his students and promised a burrito coupon to everyone who fills it out. (Yes, Fred also works as a delivery guy at the little Mexican place near one of the dorms. Also, he is a marketing genius.)
After collecting the questionnaires the next week and some well deserved bonus from his boss at the burrito place (sales went up 50%), he did a standard data analysis using his favourite statistical tool R.
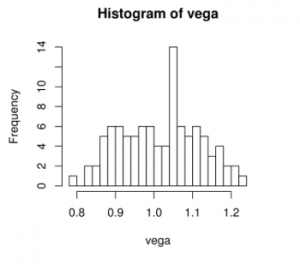
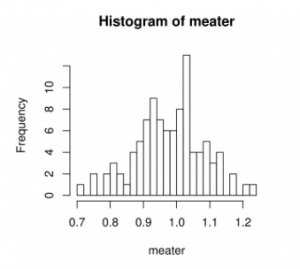
He came up with the following descriptive statistics:
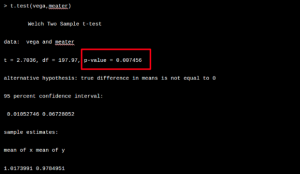
After running some tests, Fred happily discovered that he found a significant difference!
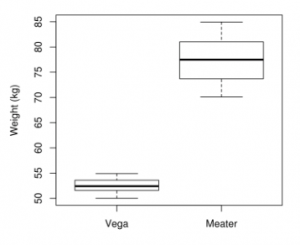
Lucky Fred also found a significant result with one of his cheap shots. Vegetarians seem to weigh significantly less than meat eaters.
After this, Fred wrote up an article, it got published and Fred and his thesis advisor (who was the last author of the paper, obviously) lived happily ever after (or at least until the need for a next paper arose).
Epilogue
A few years and burritos later, on a cold Friday night, Fred was putting together the list of his best publications for a grant. On that fateful night, Fred realised a few things about his beloved little paper:
1. Not representative sample: He made the mistake (like many other researchers) of using WEIRD people for his study.
2. Significant but not relevant: The difference between the two groups was significant, but was it relevant? The difference between the means is: 0.0389039. Which is: 38.9039 grams ~ 0.5 dl / month.
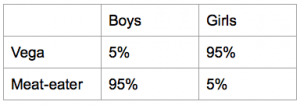
3. Correlation but not causation: Taking a closer look at his data and remembering that funny spurious correlations site he saw a few days back, he realised that most vegetarians in his study were girls, while most meat eaters were boys.
What can we do to avoid Fred’s mistakes?
- Try to eliminate systematic errors (e.g. sampling bias, human error during data collection).
- A rough idea about the expected differences can be used for sample size calculation.
- Select statistical method carefully AND check the conditions for using the test/model.
- Common sense and a fresh set of eyes on the results once in awhile can be very useful.
- Repeated (independent) experiments can also help eliminating false positives and negatives.
The problem is:
- We have a (very) limited amount of resources.
- Not all random and systematic errors can be eliminated.
- Not everything can be measured (or measured precisely enough).
- Biology is messy and overly complicated.
…but:
Statistics can be a very useful tool for discovering effects, patterns and connections, just use it carefully.
The inspiration for this post was the excellent and thought provoking article by David Colquhoun.
Written by Krisztina Rigó


